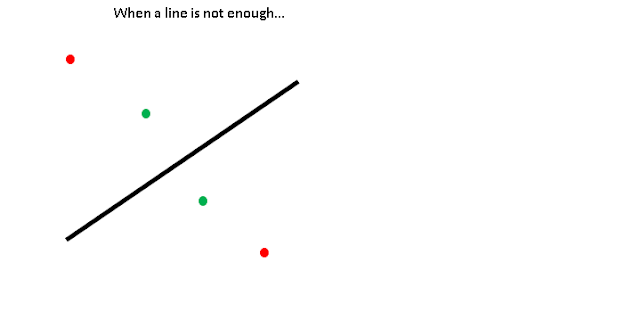
This is machine learning essential training in the previous lecture we looked at the support vector machine method, in this lecture we're going to look more deeper on it with the kernel trick. now look at this example
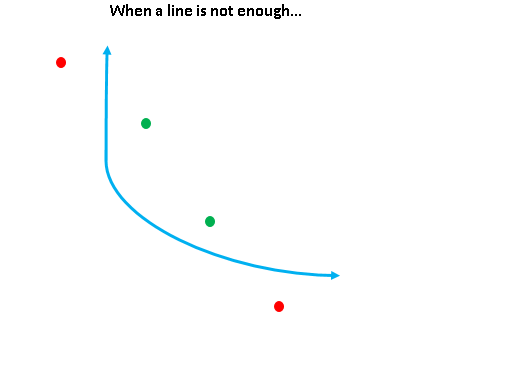
We have to think outside the box. One way of thinking outside the box is drawing this line here
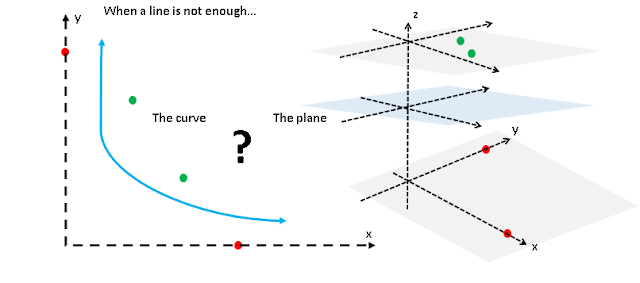
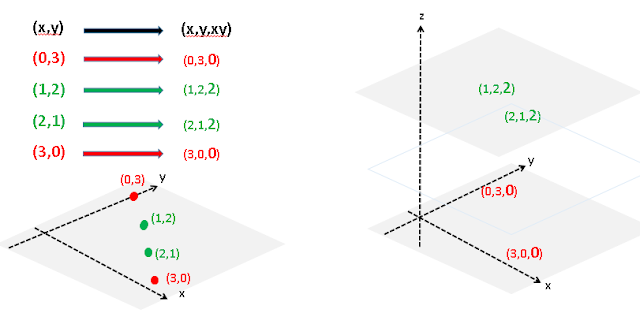
Or maybe we have to think outside the plane. If we found a way to lift the Green Point up we can easily separate them by a plane
So what do you think is better the curve on the left or the plane on the right
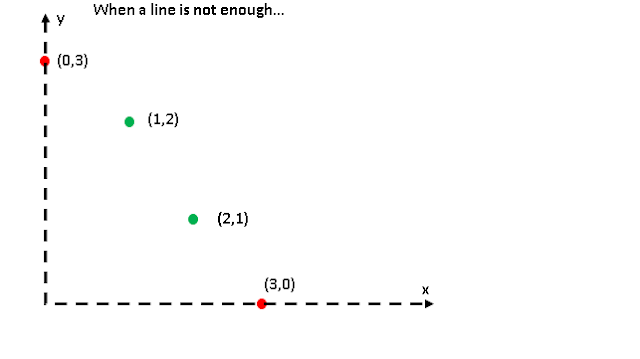
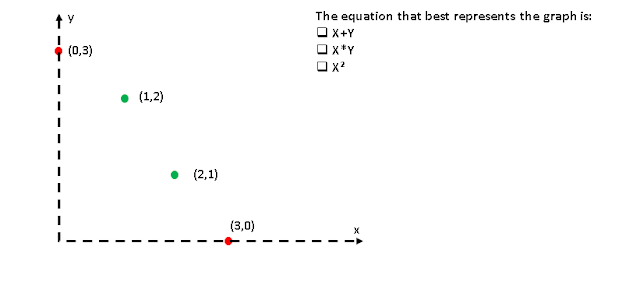
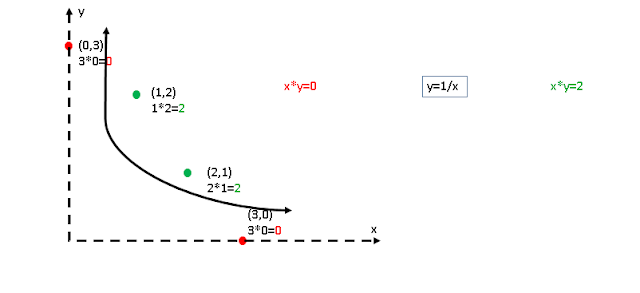
Actually these methods are the same don't get confused we're going to explore each one more deeper let's go first with the curve and let's put some coordinates on each point where at this point 0 comma 3 this one 1 comma 2 the other green point 2 comma 1 and the last red point 3 comma 0
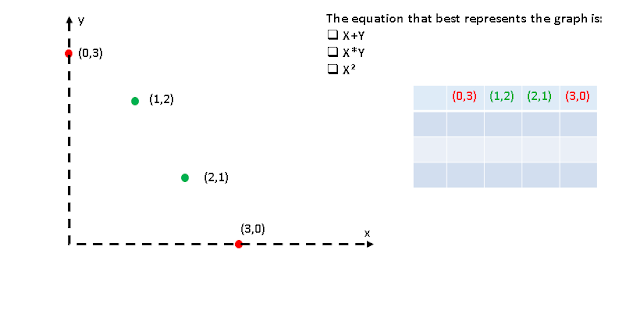
Which equation could come to our rescue in your opinion: X plus Y? the product X times Y? or X square?
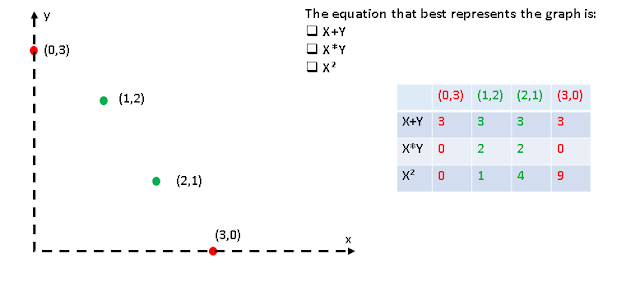
This is not an easy so let's dive in into more details, we can draw a table with the four points on the top row and the result of each function on there. For the first one X plus Y we have for the first point 0 plus 3 is 3 for the second one 1 plus 2 is 3 and for the third one 2 plus 1 is 3 and for the last one to read point 3 plus 0 is 3
With the second equation the product for the first point will have 0 and for the second one 2 times 1 is 2. For the third one 2 times 1 is 2 for the last one 3 times 0 is 0 for the last equation x squared the first coordinate squared: 0 square is 0, 1 square is 1, 2 square is 4, 3 square is 9
Feeling confused? Watch the Full Kernel Trick Video Lecture On Youtube
So if we look at the results of each equation for the first one it gives us 3 for all points on the other hand x square gives us 0 1 4 & 9 but if you look at the product X times Y it gives us 0 for the red points and 2 for the green points so that's what we was looking for: an equation that gives us big values - the green points and smaller values for the red points or vice versa, so we're going to use this equation that was the right answer now let's put the results on the graph
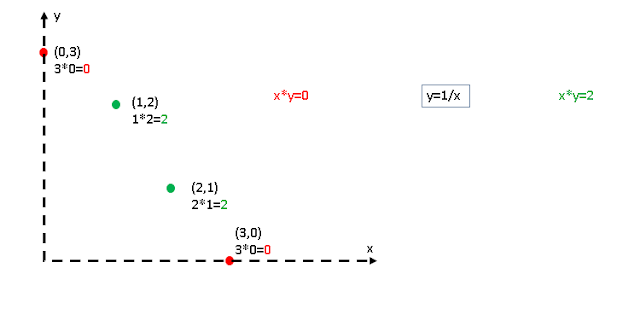
You can see that for the red points we get 0 for each one and for the green points we get x times y equals 2 and what's the PI it's 0 & 2 is 1 and what is x times y equals 1 is exactly y equals 1 over X which is the equation of hyperbola that you can see here
We can use the same function x times y to put the points on another plane so for a 3d representation we can use the coordinates X comma y comma x times y in this case the coordinate of the first point 0 comma 3 will become 0 3 0 and the point will be here for the second point the first green point the coordinates will be 1 comma 2 comma 2 and it will move up for the third point the coordinates will be 2 comma 1 and it will also move up the last point 3 comma 0 will have the coordinates 3 comma 0 comma 0 and it will be here now you can see that we have separated our points with a plane
And this is exactly the kernel trick you can think of it as a surgeon who is looking to separate apples from oranges and she got my dear she moved the apples up and she nicely cut the data in two.
